The SALDi Working Group in Remote Sensing at FSU Jena develops the satellite-based monitoring approach based on its competence in radar remote sensing together with SP4.
The sub-project description
The problem
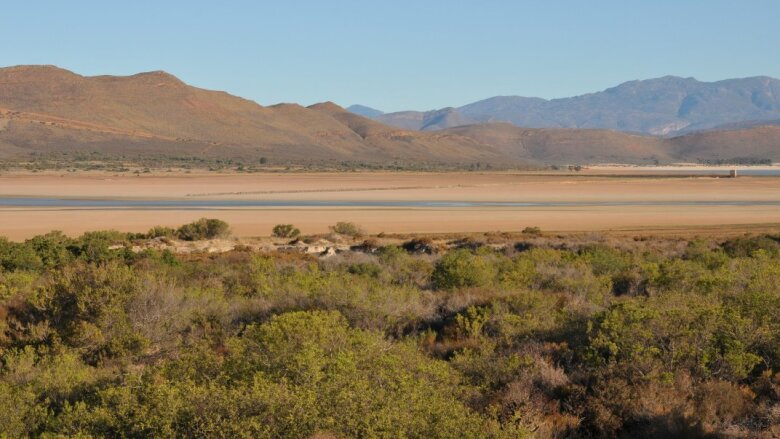
Sediments in a dried out reservoir, South Africa
Image: J. Baade 2018
The strength of the El Niño phenomenon is negative correlated with the rainfall in South Africa.
A strong El Niño year and the resulting absence of rainfall has an enormous impact on ecosystem dynamics, agricultural yields and biomass production in Southern Africa.
In the summer months of 2015/2016 there was one of the most severe dry spells since weather records began, which can be attributed to an extreme El Niño event (Fig.1).
A severe drought has far-reaching consequences (e.g. food shortages, outbreaks of diseases, medical care, etc.) for millions of people.
Remote sensing offers the possibility to analyse soil moisture dynamics and their effects on land cover.
Our objectives
A main objective of TP1.3 is the development of high-resolution spatio-temporal methods for the analysis of ecosystem changes using the latest Earth observation satellites (e.g. Sentinel-1), which serve as a basis for regional climate modelling (TP2) and synergistic intersection with other EO data (TP4).
The Chair of Remote Sensing at FSU Jena has the task to analyse ecosystem changes and dynamics. The following tasks will be performed: (1) Analysis of spatio-temporal dynamics of surface moisture and mapping of vegetation structure (e.g. biomass); (2) Validation of derived EO products (e.g. soil moisture) through terrain campaigns and cooperation with South African partners; (3) Derivation of land degradation indicators through synergetic linking of optical and radar-based EO data.
Our methodology I (soil moisture measurements)
Soil moisture measurements
Image: M. Urban 2020
Automatic soil moisture measurement networks are installed in all 6 SALDi study areas. Each of these networks consists of the following components:
a central underfloor box containing the data logger and distributor for the 8 probes
8 probes (SMT-100) on 10 m cables each, which are aligned star-shaped around the underfloor box
the probes are buried at a depth of approx. 5 - 10 cm to compare the in situ measurements with the radar satellite signal (sentinel-1 time series) (see figure above)
Our Methodology II (Radar Remote Sensing)
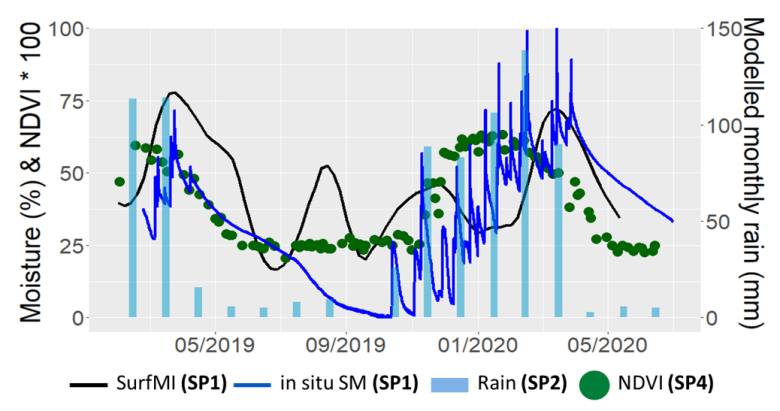
In Urban et al. (2018) the first work on soil moisture monitoring in the Kruger National Park was carried out.
The aim was to analyse the influence of the drought of 2015/16 on soil moisture and vegetation dynamics.
Good agreement was achieved between the soil moisture values measured in situ and the surface moisture derived from sentinel-1 data (C-band) (R = 0.7) (Abb. 3).
Literature
Urban, M., C. Berger, T. E. Mudau, K. Heckel, J. Truckenbrodt, V. O. Odipo, I. P. J. Smit, C. Schmullius (2018): Surface Moisture and Vegetation Cover Analysis for Drought Monitoring in the Southern Kruger National Park Using Sentinel-1, Sentinel-2, and Landsat-8. - Remote Sensing, 10, 1482.
Our cooperation
Land surface dynamics
Image: M. Urban (FSU Jena), A. Hirner (DLR)
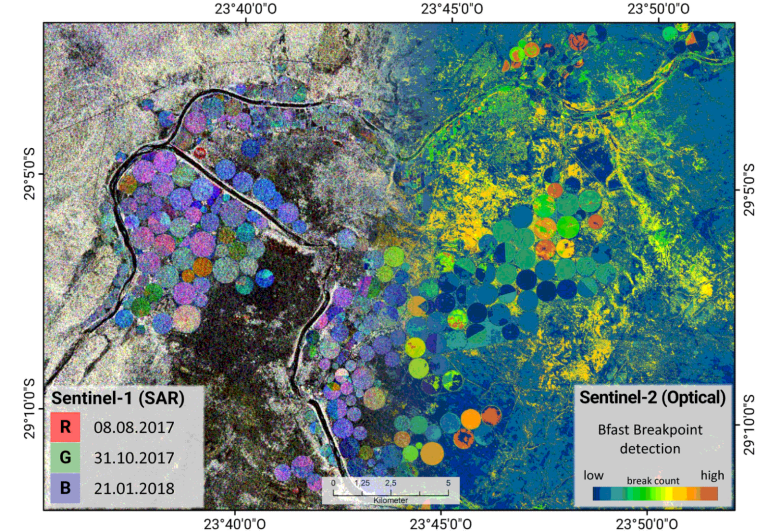
Fig.: Synergistic combination of Sentinel-1 radar (left) and Sentinel-2 optical (right) time series to monitor land surface dynamics (e.g. pivot irrigation and grasslands) near Douglas, Northern Cape Province, west of Kimberley. The figure contains modified Copernicus Sentinel data [2015 – 2020].
An example for first results provided in cooperation of the two remote sensing groups working on synergetic land surface change detection based on the optical and radar Sentinel satellites of the European Space Agency (ESA). By combining different acquisitions, the Sentinel-1 radar backscatter (Fig. 3, left) can be used to draw conclusions about cultivation dynamics (e.g. ripening processes) in agricultural areas (pivot irrigation) as well as the surrounding grasslands. The figure shows this as an RGB composite, where each color represents the backscatter intensity of one acquisition. In detail, magenta areas represent high backscatter (due to volume scattering from the crops) in August 2017 and January 2018, whereas blue regions on the left have higher backscatter in January 2018, only, which allows interpretation of the growing cycles of the pivot irrigation areas. On the right, Figure 3, presents first results of the interpretation of the optical imagery for the neighbouring area. In this case a Normalized Difference Vegetation Index (NDVI) time series (2016-2019) derived from Sentinel-2 data and processed with the BFAST (Breaks For Additive Season and Trend) algorithm highlights different land use patterns in agricultural and natural environments. Here, blue indicates a low number of changes whereas red stands for a high number of changes. Blue areas are interpreted as having a constant vegetation cycle over the entire time span, a few red areas apparently exhibit numerous changes in vegetation development, pointing to numerous crop changes. Colors in the natural vegetation are less pronounced and range from blue to yellow. Interpretation of the latter areas hints at changes in the natural vegetation cylcle. These areas need to be investigated in greater detail in order to find out, if land degradation plays a role.
Expected results
Execution of terrain campaigns to record vegetation structure and installation of soil moisture measurement network in all 6 SALDI study areas
Development of radar processing methods for the analysis of bio-physical ecosystem parameters (e.g. surface moisture and vegetation structure)
Derivation of machine learning procedures for the synergistic intersection of optical and radar-based data in the SALDI data cube
Development of indices for the analysis of land degradation in cooperation with other project partners
Teaching at SALDI Summer Schools
Current project progress SP1.3: Radar remote sensing
Field trips (March 2019 / September 2019 / March 2020)
Installation of an automated soil moisture probe network in all 6 SALDI test sites
Mapping of various vegetation parameter (e.g. vegetation structure) by utilisation data from UAV flights in each of the SALDI test regions
Validation of surface moisture extracted from Sentinel-1 time series with in situ measurements from the probe network
Analysing spatial-temporal changes and dynamics of surface moisture and vegetation structure
SALDi Project Team Radar Remote Sensing
Schmullius, Christiane, Prof. Dr
Sub-project manager (PI)Chair of Earth Observation